Pi Project
Having all of the necessary pieces and some spare time during the holidays I resurrected a project that never reached completion to measure and plot temperature with a Raspberry Pi, in this case a Pi Zero but any Pi with a GPIO header will work, and two DS18B20 temperature sensors.
Getting the Pi Zero ready
Assuming you have created an SD card with Raspberry Pi OS on it following the instructions here there are three additional steps needed to allow you to SSH into it on first boot. This can also be done through the desktop by connecting a keyboard, mouse and monitor but the Pi requires specific cables that you may not have e.g. mini-HDMI to HDMI.
- From the root directory of the SD card which should be
/bootruntouch sshwhich creates an empty file with the namesshand lets the OS know that ssh should be enabled on boot. - Still in the root directory create a file named
userconf.txtwith the single line below which creates a user named user (edit as appropriate) with password "raspberry" (change immediately after login withpasswd). This is needed since Pi OS no longer creates the default userpifor security reasons and ssh will fail as there is simply no user defined yet.user:$6$c70VpvPsVNCG0YR5$l5vWWLsLko9Kj65gcQ8qvMkuOoRkEagI90qi3F/Y7rm8eNYZHW8CY6BOIKwMH7a3YYzZYL90zf304cAHLFaZE0 - Lastly, still in the root directory, create the file
wpa_supplicant.confand add the SSID and password for your WiFi network as below, you can add additionalnetwork{}blocks which I did because I was setting it up on one network and later moving it to another:country=NL # Your 2-digit country code ctrl_interface=DIR=/var/run/wpa_supplicant GROUP=netdev update_config=1 network={ ssid="SSID" psk="password" key_mgmt=WPA-PSK }With the SD card inserted and the Pi Zero powered on it will connect to your WiFi and be ready to accept ssh connections from the user you defined, find the IP address from your router and connect.
After writing this I was trying to find out when the default pi user was removed and found this page explaining that the above steps can be done through the RPi Imager software as part of the SD card creation which may be slightly easier.
Raspberry Pi Zero Overview
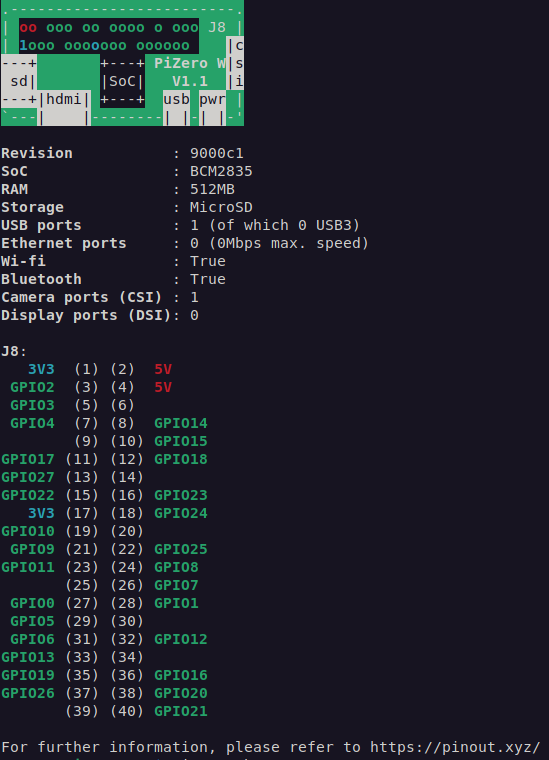
This is not absolutely necessary but gives a more detailed view of the GPIO header that we will be connecting to later. ssh to the Pi and start by installing this package:
sudo apt install python3-gpiozeroThen running the command pinout will generate the following output showing the physical layout of the Pi, some hardware configuration information and the pin assignments. Note the differences in the physical pin number and the GPIO number, these tripped me up briefly.
Connecting the Temperature Sensors
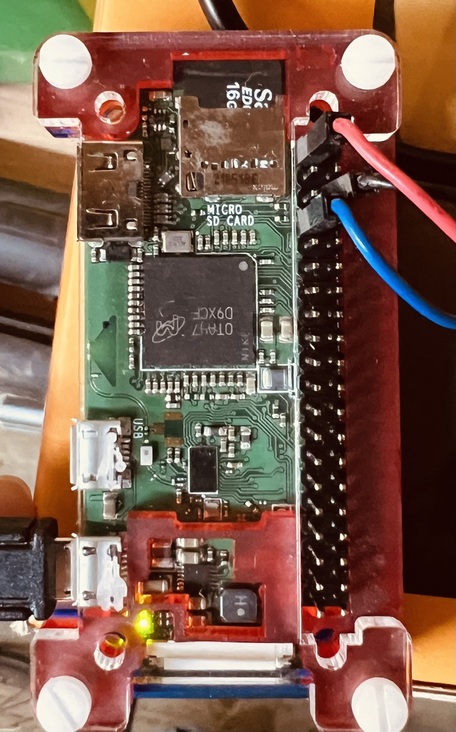
The DS18B20 temperature sensor is very easy to connect and several can be connected in parallel, I bought a pack of male-to-female jumper wires to connect to the GPIO header on the Pi. One of my sensors had yellow, red and black leads while another had yellow, red and blue, the jumper wires did not have all the matching colours, the only colour consistency in my setup is the red leads. A 4.7KΩ resistor is connected across the red and yellow leads of all sensors.
- Red wires are connected to 3.3V supply physical pin1
- Yellow wires are connected to Ground physical pin9
- Blue/black wires are connected to GPIO14 physical pin8

Enabling the Temperature Sensor
From a terminal on the Pi run sudo nano /boot/config.txt and add dtoverlay=w1-gpio to the end of the file, save and reboot. Then login and again from the terminal run:
sudo modprobe w1-gpio
sudo modprobe w1-therm
In the directory /sys/bus/w1/devices there will be one or more links to directories starting with the number 28, each of these links is a detected DS18B20 temperature sensor.
lrwxrwxrwx 1 root root 0 Dec 30 12:12 28-0000080923f1 -> ../../../devices/w1_bus_master1/28-0000080923f1
lrwxrwxrwx 1 root root 0 Dec 30 12:12 28-6885071e64ff -> ../../../devices/w1_bus_master1/28-6885071e64ff
lrwxrwxrwx 1 root root 0 Dec 30 12:26 w1_bus_master1 -> ../../../devices/w1_bus_master1
Going into any one of the directories and running cat w1_slave will show two lines of text similar to those below. The YES at the end of the first line indicates a valid measurement and the number at the end of the second line is the measured temperature in thousandths of a °C, the result below is 12.125°C since the sensor is in my garage.
c2 00 4b 46 7f ff 0e 10 04 : crc=04 YES
c2 00 4b 46 7f ff 0e 10 04 t=12125
Temperature Measuring
The base code I used is taken from this page and extended to handle multiple sensors and to write the measurements to an SQLite database which I'll use later to plot the data. Most of the code is independent of the number of found sensors but the SQL query to insert data in the example below assumes two as making it dynamic requires more work than I want to put in. Save this as temperature.py. It will create the database if it doesn't exist or connect to it without overwriting if it does. It does the same for the table that contains the data. The script measures every 300 seconds.
# Python script to read from multiple DS18B20 temperature
# sensors and write the results to a SQL database
import os
import glob
import time
import datetime
from os.path import exists
import sqlite3
from sqlite3 import Error

os.system('modprobe w1-gpio')
os.system('modprobe w1-therm')

thermometer=[]

# When the sensor is connected to the GPIO pins it shows up
# as a device named w1_slave in a directory that begins with
# 28 located under the base_dir below
base_dir = '/sys/bus/w1/devices/'
devices = glob.glob(base_dir + '28*')
number_of_thermometers=len(devices)
for therm in range(number_of_thermometers):
    thermometer.append(devices[therm] + '/w1_slave')
print("Found",number_of_thermometers,"devices")

# Database name and update frequency
update_frequency=300 # in seconds
db_name="SQLite-temp_multi_ds18b20.db"

# From https://www.sqlitetutorial.net/sqlite-python/insert/
# Create and/or connect to SQLite database
def create_connection(db_file):
    conn = None
    try:
        conn = sqlite3.connect(db_file)
    except Error as e:
        print(e)
    return conn

def read_temp_raw(device_file):
    f = open(device_file, 'r')
    lines = f.readlines()
    f.close()
    return lines

# Using the above function extract the temperature
# in millidegrees centigrade and convert to degrees
def read_temp(device_file):
    lines = read_temp_raw(device_file)
    # keep reading the file until we have a valid measurement
    # this may be overkill but it's working
    while lines[0].strip()[-3:] != 'YES':
        time.sleep(0.2)
        lines = read_temp_raw(device_file)
    # look for the text with the value and convert it to celsius
    equals_pos = lines[1].find('t=')
    if equals_pos != -1:
        temp_string = lines[1][equals_pos+2:]
        temp_in_celsius = float(temp_string) / 1000.0
        return temp_in_celsius

database = sqlite3.connect(db_name)
cursor = database.cursor()
print("Successfully Connected to SQLite")
try:
    database.execute("SELECT * FROM temperature")
    print("Table exists")
except database.OperationalError:
    print("No table called temperature.")
    if(database.OperationalError):
        try:
            table = """CREATE TABLE temperature (
                        Date_Time TEXT,
                        Temperature1 REAL,
                        Temperature2 REAL
                         ); """
            database.execute(table)
            print("Created table")
        except sqlite3.Error as e:
            print(e, "occured")

try:
    while True:
        dt=datetime.datetime.now()
        iso_time=dt.strftime('%Y-%m-%d %H:%M:%S')
        temperature=[]
        for sensor in range(number_of_thermometers):
            temperature.append(read_temp(thermometer[sensor]))
# Open the database and insert time and temperature
        database = create_connection(db_name)
        cur = database.cursor()
        sqlite_insert_query = """INSERT INTO temperature
                          (Date_Time, Temperature1, Temperature2)
                           VALUES (?, ?, ?) """
        count = cur.execute(sqlite_insert_query, (iso_time, temperature[0], temperature[1]))
        database.commit()
        database.close()
        print("Measurement", cur.lastrowid,": Temperature at", iso_time)
        for sensor in range(number_of_thermometers):
            print("Sensor",sensor,": ", temperature[sensor],"C", sep="")
        time.sleep(update_frequency)

except sqlite3.Error as error:
    print("Failed to insert data into sqlite table", error)

except KeyboardInterrupt:
    print("Closing database")
Running the measurements as a service
In order to always have the measurements running if for example the Pi is rebooted I created a systemd service file called temperature.service (you can use any name) which should be saved in /etc/systemd/system/, make sure to edit the lines for WorkingDirectory and ExecStart to match the location of your script. These do not need to be the same place but I chose to have the SQLite database in the same directory as the python script.
[Unit]
Description=Measure ambient temperature with DS18B20 sensors
After=multi-user.target

[Service]
WorkingDirectory=/path/to/pythonscript
ExecStart=/usr/bin/python3 /path/to/pythonscript/temperature.py
Type=simple

Restart=always
RestartSec=10

StandardOutput=syslog
StandardError=syslog

[Install]
WantedBy=multi-user.target
This starts the service when the Pi starts.
sudo systemctl enable temperatureThis can be used to start it manually in the background
sudo systemctl start temperatureTemperature Plotting Software
I'm using Plotly to plot the measured data, I started with Matplotlib which was easier to get a static plot generated but ultimately less flexible. Assuming python3 is already installed which it should be on a default Pi OS install, run the following:
sudo pip3 install numpy plotly dashIf the below error happens when running the script below then an extensive error page appears including this link
libf77blas.so.3: cannot open shared object file: No such file or directorywhich will suggest the solution below which worked, an alternative solution is proposed in addition but I didn't need/try that.
sudo apt-get install libatlas-base-devThe code below is the result of many iterations and not from any one source, it assumes that the SQLite database has the same name as the one created by the measurement script and that it is in the same directory.
# Read date and temperature from an
# SQL database and plot it live with plotly

import pandas as pd
import plotly.express as px
from plotly.subplots import make_subplots
import plotly.graph_objects as go # or plotly.express as px
import dash
from dash import Dash, dcc, html, Input, Output
import sqlite3
from sqlite3 import Error

db_name="SQLite-temp_multi_ds18b20.db"
app = dash.Dash(__name__)

app.layout = html.Div(
    [
        dcc.Graph(id = 'live-graph', animate = False),
        dcc.Interval(
            id = 'graph-update',
            interval = 10000,
            n_intervals = 0
        ),
    ]
)

@app.callback(
    Output('live-graph', 'figure'),
    [ Input('graph-update', 'n_intervals') ]
)

def update_graph_scatter(n):
    conn=sqlite3.connect(db_name)
    df = pd.read_sql("select * from temperature", con=conn)
    conn.close()
# next line reads from a .csv file, was replaced with the lines above
#  df = pd.read_csv('temperature.csv')
# The column titles are defined when the database is created
# and the same ones have to be used here
    fig = make_subplots(rows=2, cols=1)
#    fig=go.Figure()
    fig.add_trace(go.Histogram(x = df['Date_Time'], y = df['Temperature1'],
                                   histfunc="avg", name="Daily Average",
                                   xbins=dict(size="D1")),row=1,col=1)
    fig.add_trace(go.Scatter(x = df['Date_Time'], y = df['Temperature1'],
                             name='Inside'),row=1,col=1)
    fig.add_trace(go.Histogram(x = df['Date_Time'], y = df['Temperature2'],
                                   histfunc="avg", name="Daily Average",
                                   xbins=dict(size="D1")),row=2,col=1)
    fig.add_trace(go.Scatter(x = df['Date_Time'], y = df['Temperature2'],
                             name='Outside'),row=2,col=1)
    fig.update_layout(width=1200, height=800,bargap=0.1)
    fig.update_layout(legend=dict(
                      orientation="h",
                      bgcolor="White",bordercolor="Black",
                      borderwidth=1,
                      yanchor="bottom", xanchor="center",
                      y=1.02,x=0.5),
                      font=dict(size=16))
    fig.write_html("temperature.html")
    return fig

if __name__ == '__main__':
    app.run_server(host='0.0.0.0', port='5051')
Visiting http://pi-IP:5051 in a browser window displays an interactive plot that updates when new data is found. There is one plot for each sensor with all measured data points shown as a line and a histogram bar for each day that is the daily average. Despite the legend, both sensors are inside on the plot below, I need to find a way to position one of them outside.
Alternatively, the interactive Plotly plot can be exported to a fully self-contained html file using:
fig.write_html("temperature.html")` and included in this post via
<iframe width="750" height="600" name="iframe" src="temperature.html"></iframe>